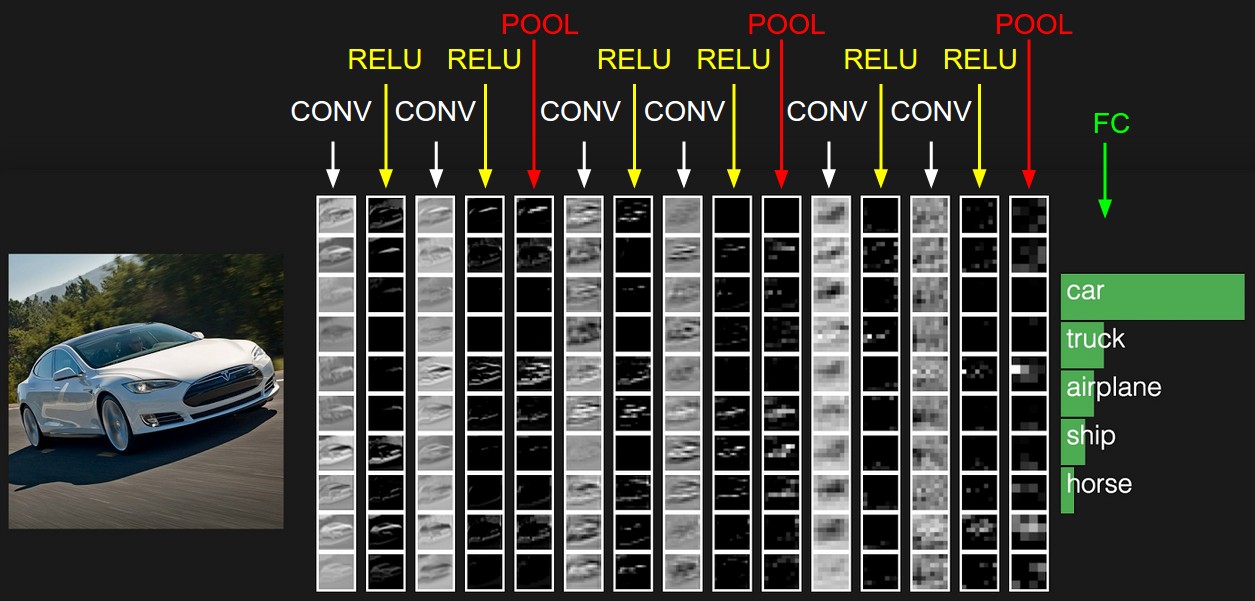
Convolutional Neural Networks (CNNs) are made of many layers stacked together, each transforming the input image into more abstract representations. Although we often try to «visualise» what a CNN has learned, a well‑known fact is that only the filters in the very first convolutional layer can be displayed directly as RGB images.
The First Layer Has Filters With Depth = 3 (Matching RGB Channels)
A standard colour image has shape:
Height × Width × 3
The final dimension «3» corresponds to the three colour channels:
- R = red
- G = green
- B = blue
A convolutional filter in the first layer must have the same depth as the input it processes.
So if the input has 3 channels, the filter also has depth 3:
Filter shape (example): 7 × 7 × 3
This 3‑channel structure is directly compatible with how a computer displays colour images.
Each filter can therefore be mapped to an image where:
- One slice = red intensity
- One slice = green intensity
- One slice = blue intensity
The first layer is like looking at the world with three coloured glasses.
Deeper Layers Do Not Operate on RGB Anymore
Once the first layer processes the image, the network no longer deals with R/G/B.
Instead, the output becomes a set of feature maps, each representing a specific learned pattern:
- vertical edges
- horizontal edges
- corners
- textures
- colour‑invariant shapes
- patterns that correspond to parts of objects
- highly abstract concepts
If the first layer has, for example, 64 filters, then it produces an output of:
Height × Width × 64
This means the next layer receives 64 channels, not 3.
Therefore, a deeper filter might look like:
3 × 3 × 64
or
5 × 5 × 128
There is no natural way to map 64 or 128 channels to the 3 RGB channels.
Imagine you mix together 64 crayons at once.
You can’t draw a simple picture from that — it becomes something abstract.
Deeper layers «see» the world using many more channels than our eyes can understand.
Channel Explosion Makes RGB Visualisation Impossible
As the network goes deeper:
- The number of channels grows (64 → 128 → 256 → 512…).
- Each filter corresponds to a 3D block with depth = number of input channels.
- The depth becomes far larger than 3.
If you wanted to “convert” 128 channels into RGB:
- Which channels map to Red?
- Which map to Green?
- Which to Blue?
- How to combine them?
- How to keep the interpretation consistent?
There is no principled answer.
Any mapping would be arbitrary, misleading, and meaningless.
You can only make a coloured drawing if you have three crayons.
If someone gives you 128 crayons at once, you don’t know how to use them to draw one picture.
Deep Filters Represent Concepts, Not Colours
Deeper layers represent:
- edges and textures
- object parts
- shapes
- semantic concepts
- class‑specific structures
- patterns created by combinations of earlier features
These concepts do not exist in RGB space.
They are abstract mathematical features extracted from the original image.
A deep filter may look like:
- «respond strongly when it sees an eye‑shaped pattern»
- «activate for a circular texture»
- «detect a high‑level part of a specific object class»
These are not images — they are instructions for detecting patterns.
The early layers look at colours.
Later layers look at ideas, like “eye shape”, “fur texture”, or “circle pattern”.
Ideas cannot be drawn with red/green/blue colours.
Instead of Showing Filters, We Show Their Effects
Because the raw filter weights in deep layers cannot be converted to RGB, researchers use alternative visualisation methods:
Feature maps
Show which regions of the image activate a given filter.
Activation maximisation
Generate an artificial image that maximally triggers a neuron.
Guided backpropagation
Highlight pixels that contribute most to an activation.
Class activation maps (CAM / Grad‑CAM)
Visualise what part of the image the network uses to make a prediction.
These methods reveal what a filter is “looking for,” even if we cannot display the filter itself as a picture.
Meaningful visualisation of deeper layers requires activation‑based techniques, not raw kernel inspection.
Additional Resources
“How to Visualize Filters and Feature Maps in Convolutional Neural Networks”
Autor: Jason Brownlee
Sitio: Machine Learning Mastery
Visualizing representations of Outputs/Activations of each CNN layer
CS231n – Convolutional Neural Networks (Stanford)
© Image. https://cs231n.github.io
 @Yolanda Muriel
