This article is a Step‑by‑Step Guide of how Running and Debugging a Deep learning Model/Project in Visual Studio Code.
Install Visual Studio Code
If you don’t already have it installed:
- Download it from the official website: https://code.visualstudio.com
- Install it using the default options.
Open the Project Folder in VS Code
Launch Visual Studio Code.
Go to File : Open Folder.
Navigate to the location where you cloned the project, for example:
C:\Users\xxx…
Click Select Folder.
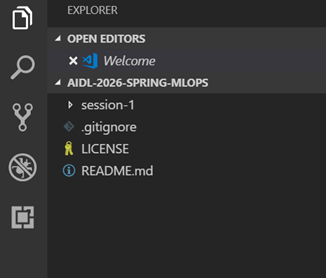
VS Code will now load your project with all files visible on the left sidebar (Explorer).
Select the Correct Python Interpreter
Since your project uses a virtual environment (.venv), VS Code must use it:
- Press Ctrl + Shift + P (Command Palette).
- Type
Python: Select Interpreter
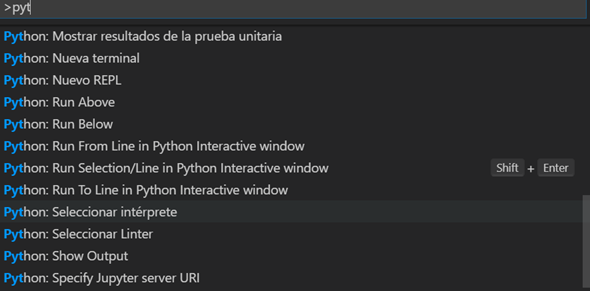
Choose the interpreter that contains .venv in the path.
Example:
.venv\Scripts\python.ex
You’re officially ready to run, debug, and step through your Python code in Visual Studio Code.
Since the .venv interpreter appears:
- VS Code recognizes your virtual environment.
It is using the correct Python version.
You can now run the project inside VS Code.
You can debug, set breakpoints, and inspect variables.
Everything is ready for full development and debugging.
Now that the interpreter is linked, here’s how you can run and debug your MLOps project:
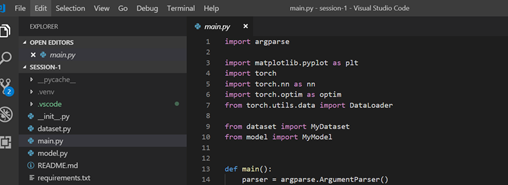
Open main.py in VS Code
Simply click on it from the sidebar.
Add breakpoints
Click to the left of a line number to place a red dot.
For example, inside the training loop.
![]()
A breakpoint is a marker you place in your code that tells the debugger to pause the program at a specific line.
When the program reaches that line, execution stops, allowing you to inspect what is happening inside the code.
Breakpoints are used to:
- Stop the program at an exact line
- Check variable values at that moment
- Step through the code line by line
- Find errors or unexpected behavior
- Understand how the program flows
In Visual Studio Code, you set a breakpoint by clicking in the left margin next to the line number.
A red dot appears to indicate the breakpoint.
When you start debugging (F5), the program runs normally until it reaches the breakpoint, then pauses so you can analyze what is happening.
Start debugging
Press F5 or:
- Go to Run : Start Debugging
The program will run and stop at your breakpoint.
Inspect variables
Use the left panel:
- Variables : shows all live variables
- Watch : you can add variables to track
- Call Stack : see where the code is pausedStep through the code
Use the toolbar at the top:
- Step Over (F10) → next line
- Step Into (F11) → go inside function calls
- Continue (F5) → run to next breakpoint
View the plot
The training loss plot will appear normally, even during debugging.
 @Yolanda Muriel
