Introduction
We explore how to monitor machine learning models using TensorBoard, focusing on two fundamental deep learning tasks:
- Image reconstruction using an autoencoder
- Digit classification using a simple neural network
Both tasks were trained using a subset of the MNIST dataset, which contains 28×28 grayscale images of handwritten digits (0–9).
The goal was not to achieve state‑of‑the‑art performance, but rather to understand how to log, visualize, and interpret different training metrics and model insights using TensorBoard.
TensorBoard allowed us to track:
- Training and validation loss curves
- Model accuracy (for classification)
- Reconstructed images from the autoencoder
- Confusion matrix for the classifier
- Model graph
- Weight and gradient histograms
- Latent‑space embeddings
Environment Setup and Execution
We created a Python virtual environment, installed required dependencies, and executed the two experiments with the following commands:
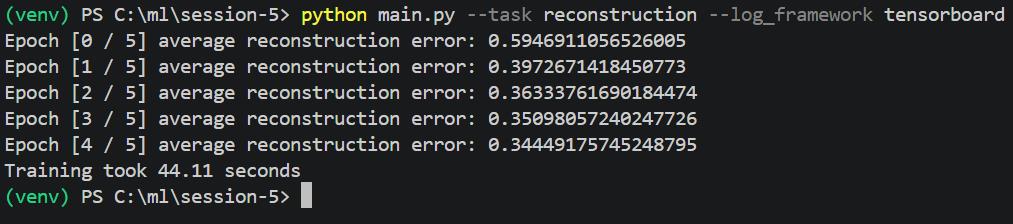
Reconstruction task
python main.py –task reconstruction –log_framework tensorboard
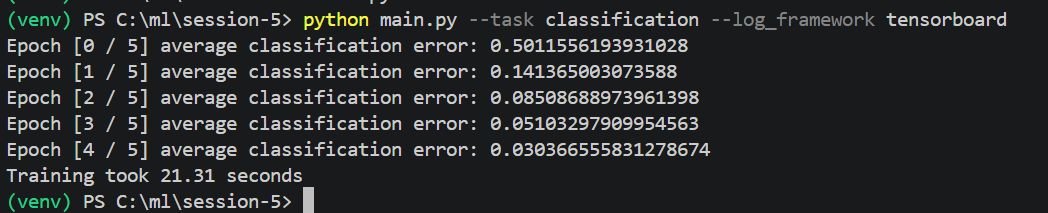
Classification task
python main.py –task classification –log_framework tensorboard
Despite initial challenges related to Windows’ TensorBoard executable, we ultimately launched TensorBoard successfully via the VS Code built‑in TensorBoard viewer, ensuring full visualization of logs.
Reconstruction Task: Autoencoder
Objective
The reconstruction task trains an autoencoder, composed of:
- an encoder that compresses images into a low‑dimensional latent representation.
- a decoder that reconstructs the original image from this compressed representation.
TensorBoard lets us visualize both:
- numerical metrics (loss curves)
- qualitative output (reconstruction images)
Training and Validation Loss
These curves describe how well the autoencoder learns to reproduce input images.
- The training loss decreases smoothly across epochs, indicating that the model is fitting the training data.
- The validation loss follows a similar trend, demonstrating that the model generalizes well to unseen data.
The convergence of both curves suggests that the model architecture and training parameters are stable and effective.
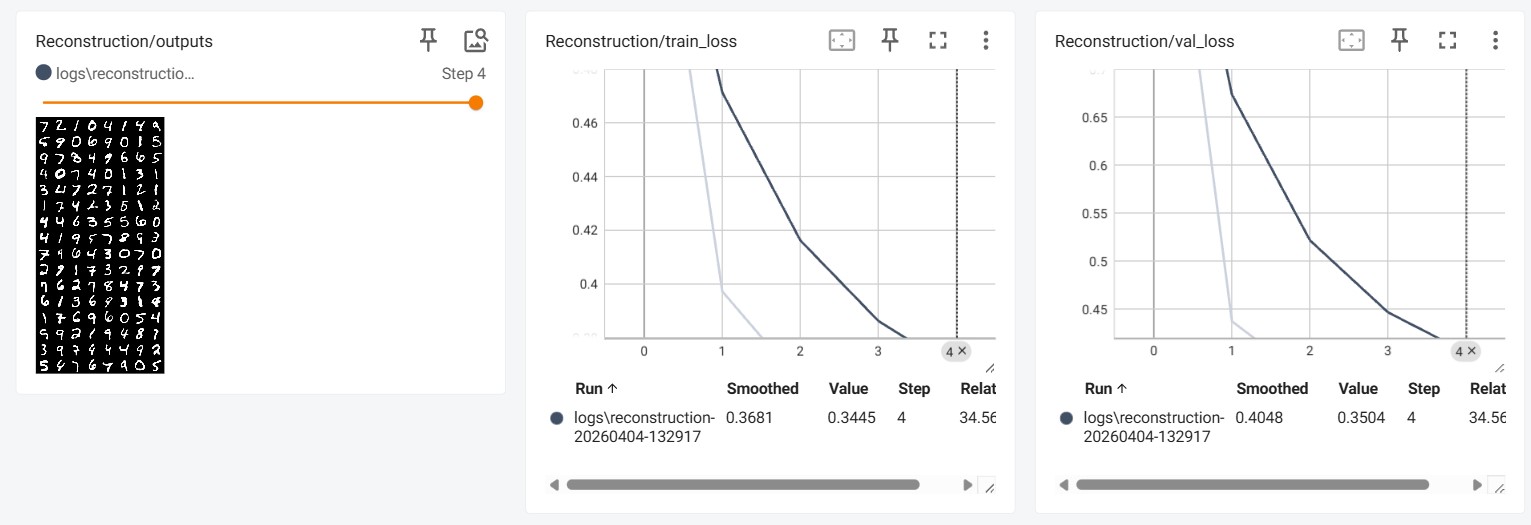
Reconstruction Outputs
This image shows a batch of MNIST digits alongside their reconstructed versions.
Interpretation:
- The reconstructed digits retain the general shape and structure of the originals.
- Some fine details may be slightly blurred — typical for simple autoencoders with limited latent dimensions and shallow networks.
- Overall, the model succeeds at capturing the essential patterns of handwritten digits.
This visual confirmation is crucial, as numerical loss alone cannot indicate whether reconstructions look good.
Weight and Gradient Histograms
(Insert image: histograms)
TensorBoard’s histogram plots show the distribution of:
- network weights
- corresponding gradients
throughout training.
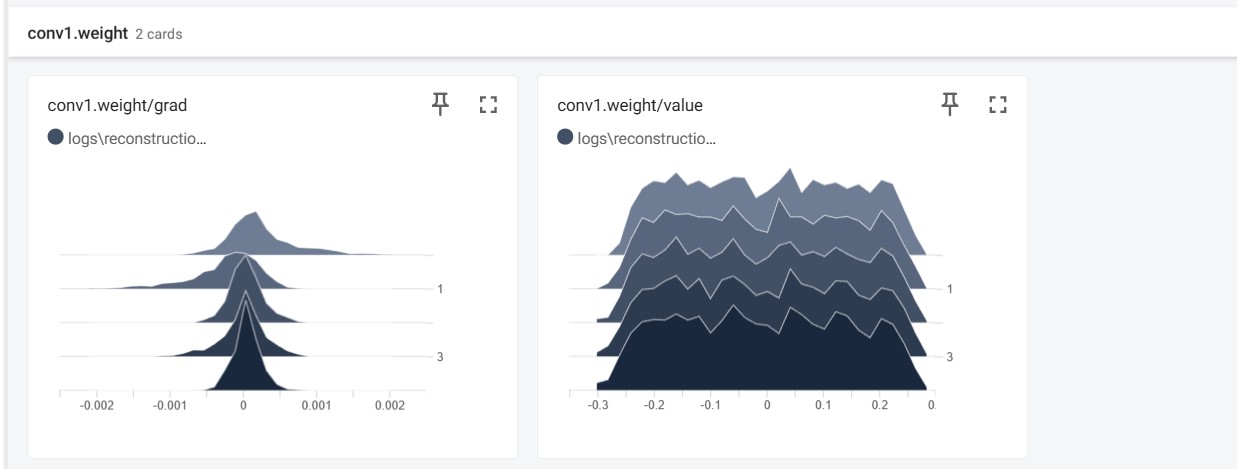
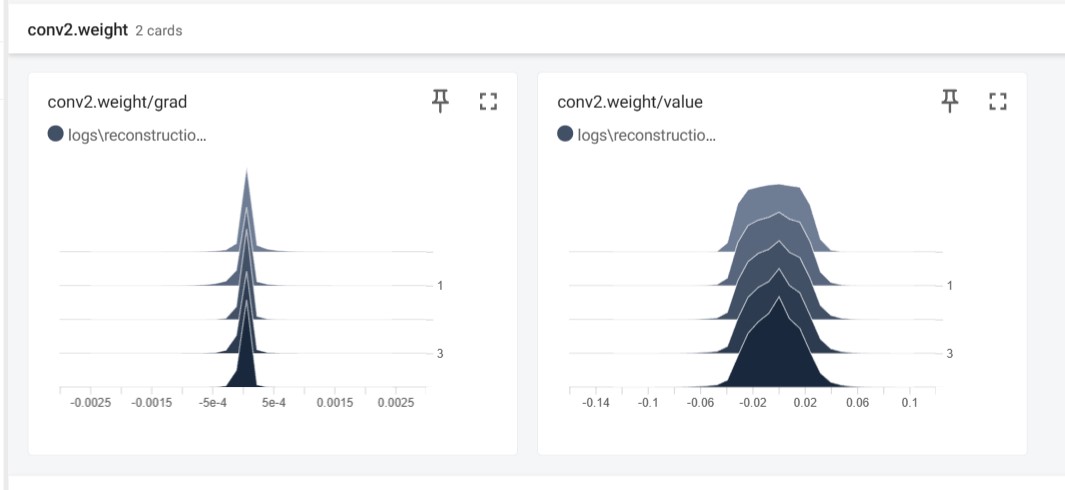
Observations:
- Weights remain within reasonable ranges and do not diverge.
- Gradients are neither vanishing nor exploding.
- The distributions evolve gradually, indicating healthy learning dynamics.
These diagnostics are particularly valuable when debugging unstable training.
3.5 Embedding Projector (Latent Space)
The embedding projector visualizes the model’s internal representation space.
Insights:
- Even a simple autoencoder forms clusters corresponding to different digits.
- This shows that the encoder learns meaningful structure without being explicitly trained for classification
Classification Task
Objective
The classification task trains a neural network to predict the digit (0–9) shown in a given MNIST image.
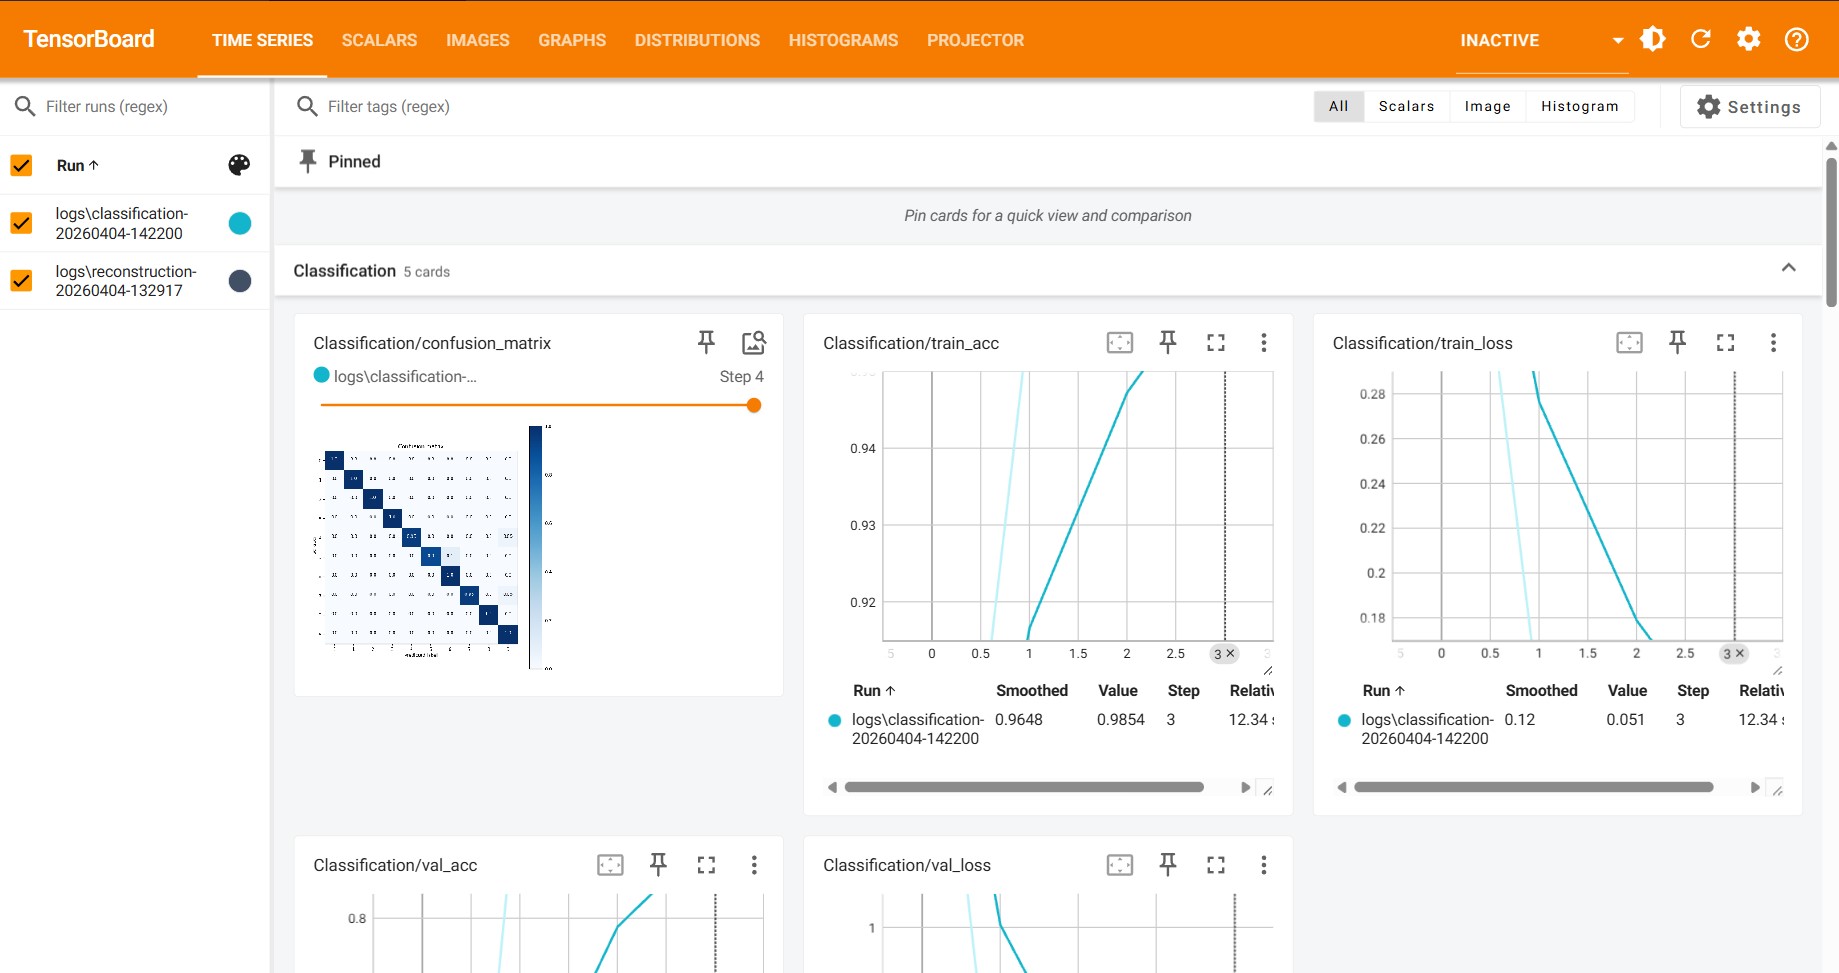
TensorBoard helps track accuracy and visualize the confusion matrix for performance evaluation.
Loss and Accuracy Curves
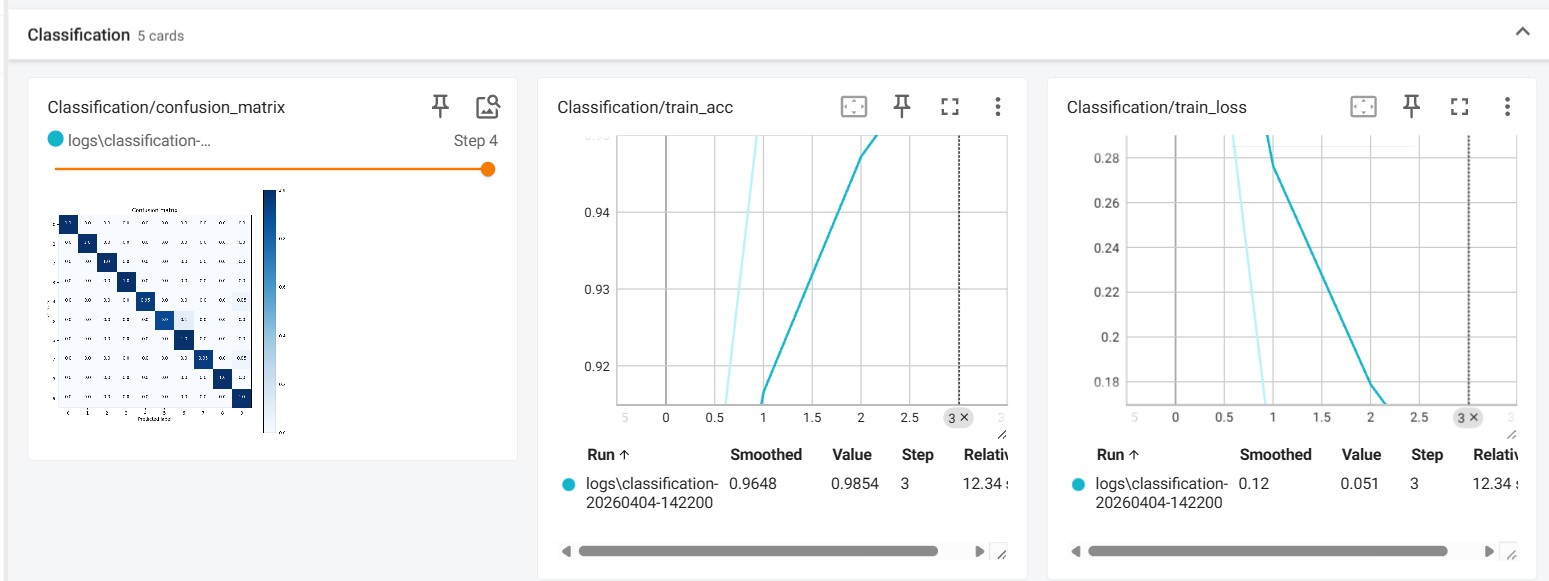
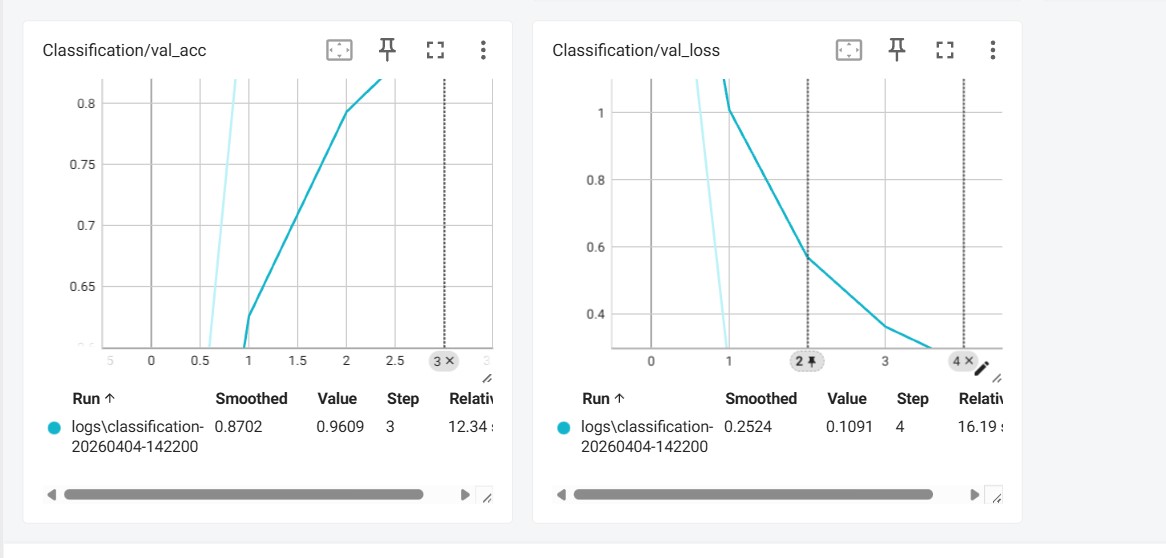
Interpretation:
- Training loss decreases steadily, showing the model is learning.
- Validation loss also decreases, indicating good generalization.
- Both training and validation accuracy rise quickly, reaching high levels within just a few epochs.
- The proximity between train and validation curves suggests little to no overfitting.
This means the classifier is learning efficiently and effectively.
Confusion Matrix
The confusion matrix visually summarizes prediction performance across all classes.
Observations:
- The diagonal is bright and continuous : most predictions are correct.
- Only a few off‑diagonal errors appear : typical confusion between similar digits (e.g., 4 / 9, 3 / 5).
- The classifier performs very well given the small number of epochs and simple architecture.
Model Graph
The TensorBoard graph viewer displays the complete architecture:
- Input layer
- Hidden layers
- Output softmax layer
This is useful for understanding the forward pass structure and debugging complex networks.
Conclusions
This project demonstrated the power of TensorBoard as a monitoring and visualization tool in deep learning workflows.
Through the reconstruction and classification experiments, we used TensorBoard to:
- Track training/validation metrics in real time
Visualize autoencoder reconstructions
Inspect classifier confusion matrices
View the entire computation graph
Observe weight and gradient evolution
Explore latent representations
These tools are essential for diagnosing model behavior, identifying training issues, and communicating results clearly.
The combination of quantitative curves and qualitative visualizations provides a complete perspective on model performance, far beyond what simple print statements can offer.
Conclusions
This demonstrates how TensorBoard transforms raw training processes into clear, interpretable visual insights.
Through the reconstruction and classification tasks, we successfully logged and analyzed:
Quantitative metrics:
- Training and validation loss
- Training and validation accuracy
Qualitative results:
- Reconstructed MNIST images
- Confusion matrix
Internal model behavior:
- Weight distributions
- Gradient dynamics
- Latent embeddings
- Model graph
Overall
This experiment highlights the essential role of visual monitoring in modern deep learning workflows. TensorBoard offers intuitive, powerful tools that make debugging, understanding, and presenting your models both faster and more effective.
 @Yolanda Muriel
